TABLE OF CONTENTS
1 INTRODUCTION (Page No. - 37)
1.1 STUDY OBJECTIVES
1.2 MARKET DEFINITION
1.2.1 INCLUSIONS AND EXCLUSIONS
1.2.2 DEFINITION AND INCLUSIONS, BY RESIN TYPE
1.2.3 DEFINITION AND INCLUSIONS, BY PRODUCT
1.2.4 DEFINITION AND INCLUSIONS, BY TECHNOLOGY
1.2.5 DEFINITION AND INCLUSIONS, BY APPLICATION
1.3 MARKET SCOPE
FIGURE 1 ENGINEERED WOOD ADHESIVES MARKET SEGMENTATION
1.3.1 REGIONS COVERED
1.3.2 YEARS CONSIDERED
1.4 CURRENCY CONSIDERED
TABLE 1 USD EXCHANGE RATE, 2019–2022
1.5 UNITS CONSIDERED
1.6 STAKEHOLDERS
1.7 RECESSION IMPACT
2 RESEARCH METHODOLOGY (Page No. - 44)
2.1 RESEARCH DATA
FIGURE 2 ENGINEERED WOOD ADHESIVES MARKET: RESEARCH DESIGN
2.1.1 SECONDARY DATA
2.1.1.1 Key data from secondary sources
2.1.2 PRIMARY DATA
2.1.2.1 Key data from primary sources
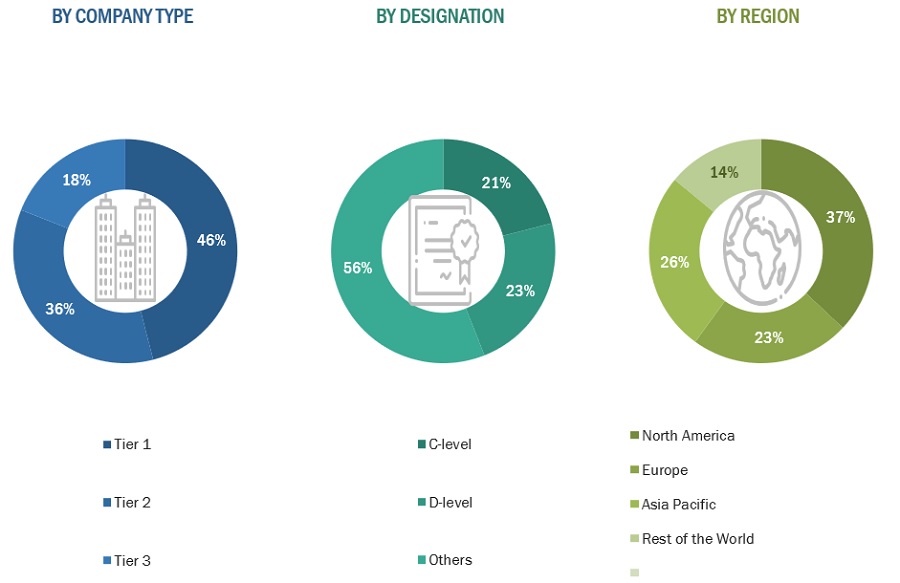
2.1.2.2 Breakdown of interviews with experts
FIGURE 3 BREAKDOWN OF INTERVIEWS WITH EXPERTS
2.1.2.3 Primary data sources
2.1.2.4 Key industry insights
2.2 MARKET SIZE ESTIMATION
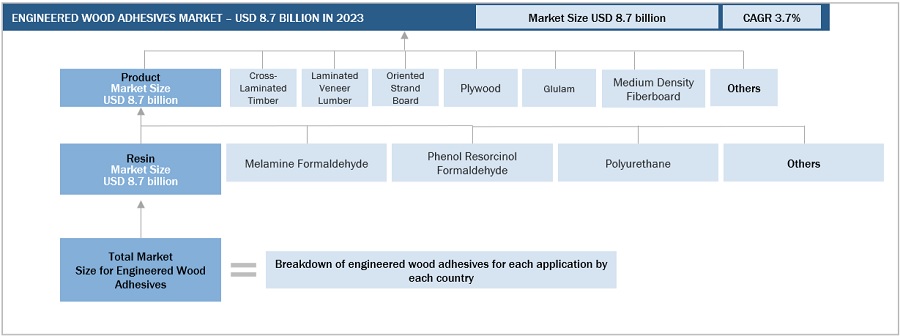
2.2.1 BOTTOM-UP APPROACH
FIGURE 4 MARKET SIZE ESTIMATION: BOTTOM-UP APPROACH
2.2.2 TOP-DOWN APPROACH
FIGURE 5 MARKET SIZE ESTIMATION: TOP-DOWN APPROACH
FIGURE 6 ENGINEERED WOOD ADHESIVES MARKET ESTIMATION, BY RESIN TYPE
FIGURE 7 ENGINEERED WOOD ADHESIVES MARKET SIZE ESTIMATION, BY REGION
2.3 MARKET FORECAST APPROACH
2.3.1 SUPPLY-SIDE FORECAST
FIGURE 8 ENGINEERED WOOD ADHESIVES MARKET: SUPPLY-SIDE FORECAST
2.3.2 DEMAND-SIDE FORECAST
FIGURE 9 ENGINEERED WOOD ADHESIVES MARKET: DEMAND-SIDE FORECAST
FIGURE 10 METHODOLOGY FOR SUPPLY-SIDE SIZING OF ENGINEERED WOOD ADHESIVES MARKET
2.4 FACTOR ANALYSIS
FIGURE 11 MAJOR FACTORS RESPONSIBLE FOR GLOBAL RECESSION AND THEIR IMPACT ON MARKET
2.5 DATA TRIANGULATION
FIGURE 12 ENGINEERED WOOD ADHESIVES MARKET: DATA TRIANGULATION
2.6 ASSUMPTIONS
2.7 LIMITATIONS
2.8 GROWTH FORECAST
2.9 RISK ASSESSMENT
TABLE 2 ENGINEERED WOOD ADHESIVES MARKET: RISK ASSESSMENT
2.1 RECESSION IMPACT ANALYSIS
3 EXECUTIVE SUMMARY (Page No. - 56)
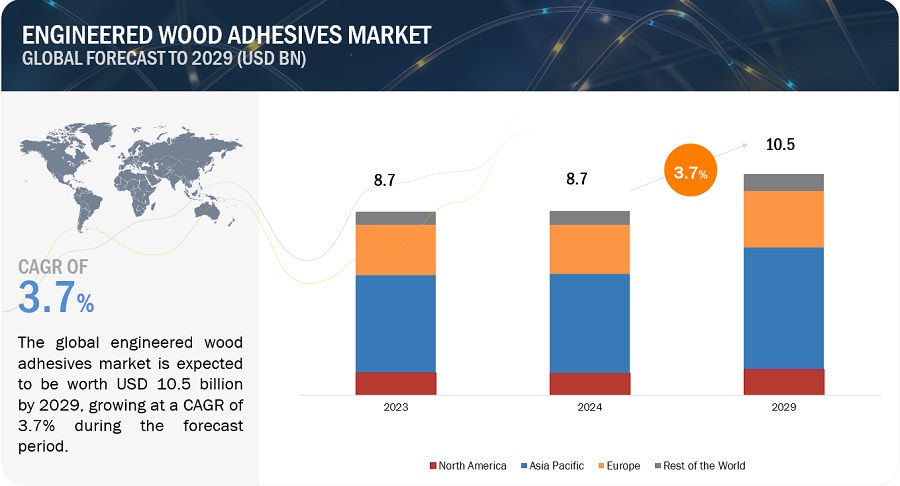
TABLE 3 ENGINEERED WOOD ADHESIVES MARKET SNAPSHOT (2024 VS. 2029)
FIGURE 13 MELAMINE FORMALDEHYDE TO BE LARGEST RESIN SEGMENT IN ENGINEERED WOOD ADHESIVES MARKET
FIGURE 14 PLYWOOD TO DOMINATE OVERALL MARKET DURING FORECAST PERIOD
FIGURE 15 MEDIUM DENSITY FIBERBOARD TO DOMINATE MARKET DURING FORECAST PERIOD
FIGURE 16 NON-STRUCTURAL APPLICATION TO ACCOUNT FOR LARGER SHARE OF ENGINEERED WOOD ADHESIVES MARKET
FIGURE 17 ASIA PACIFIC TO RECORD HIGHEST CAGR DURING FORECAST PERIOD
4 PREMIUM INSIGHTS (Page No. - 61)
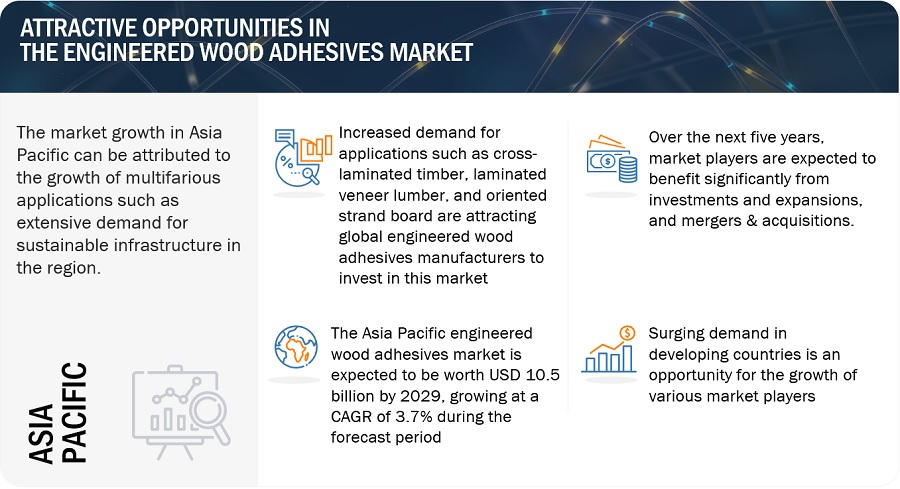
4.1 ATTRACTIVE OPPORTUNITIES FOR PLAYERS IN ENGINEERED WOOD ADHESIVES MARKET
FIGURE 18 EMERGING ECONOMIES TO OFFER LUCRATIVE GROWTH OPPORTUNITIES FOR MARKET PLAYERS
4.2 ENGINEERED WOOD ADHESIVES MARKET, BY RESIN
FIGURE 19 MELAMINE FORMALDEHYDE SEGMENT TO DOMINATE MARKET DURING FORECAST PERIOD
4.3 ENGINEERED WOOD ADHESIVES MARKET IN ASIA PACIFIC, BY RESIN TYPE AND COUNTRY
FIGURE 20 CHINA ACCOUNTED FOR LARGEST SHARE OF ENGINEERED WOOD ADHESIVES MARKET IN ASIA PACIFIC
4.4 ENGINEERED WOOD ADHESIVES MARKET, DEVELOPED VS. EMERGING ECONOMIES
FIGURE 21 EMERGING COUNTRIES TO REGISTER HIGHER GROWTH DURING FORECAST PERIOD
4.5 ENGINEERED WOOD ADHESIVES MARKET, BY KEY COUNTRIES
FIGURE 22 INDIA TO RECORD HIGHEST GROWTH DURING FORECAST PERIOD
5 MARKET OVERVIEW (Page No. - 64)
5.1 INTRODUCTION
5.2 TYPES OF ADHESIVES USED IN MODERN WOOD PRODUCTS
5.3 ENGINEERED WOOD ADHESIVE PROJECTS
5.4 KEY EMERGING ECONOMIES VS. EU27 AND US
FIGURE 23 AVERAGE CHEMICAL PRODUCTION GROWTH PER ANNUM (2011–2021)
5.5 MARKET DYNAMICS
FIGURE 24 DRIVERS, RESTRAINTS, OPPORTUNITIES, AND CHALLENGES IN ENGINEERED WOOD ADHESIVES MARKET
5.5.1 DRIVERS
5.5.1.1 Growth of building & construction industry in emerging economies
5.5.1.2 Increasing urban population
5.5.1.3 Rising demand in North America
5.5.1.4 Capacity expansion to cater to increasing demand
5.5.2 RESTRAINTS
5.5.2.1 Volatility in raw material prices
5.5.3 OPPORTUNITIES
5.5.3.1 Establishing authenticity through various certifications
5.5.3.2 Rising demand for sustainable infrastructure
5.5.4 CHALLENGES
5.5.4.1 Shifting rules and changing standards
5.6 PORTER’S FIVE FORCES ANALYSIS
TABLE 4 ENGINEERED WOOD ADHESIVES MARKET: PORTER’S FIVE FORCES ANALYSIS
FIGURE 25 PORTER’S FIVE FORCES ANALYSIS: ENGINEERED WOOD ADHESIVES MARKET
5.6.1 THREAT FROM NEW ENTRANTS
5.6.2 THREAT OF SUBSTITUTES
5.6.3 BARGAINING POWER OF BUYERS
5.6.4 BARGAINING POWER OF SUPPLIERS
5.6.5 INTENSITY OF COMPETITIVE RIVALRY
5.7 KEY STAKEHOLDERS AND BUYING CRITERIA
5.7.1 KEY STAKEHOLDERS IN BUYING PROCESS
FIGURE 26 INFLUENCE OF STAKEHOLDERS ON BUYING PROCESS
TABLE 5 INFLUENCE OF STAKEHOLDERS ON BUYING PROCESS FOR TOP APPLICATIONS (%)
5.7.2 BUYING CRITERIA
FIGURE 27 KEY BUYING CRITERIA FOR ENGINEERED WOOD ADHESIVES
TABLE 6 KEY BUYING CRITERIA FOR ENGINEERED WOOD ADHESIVES
5.8 MACROECONOMIC INDICATORS
5.8.1 INTRODUCTION
5.8.2 GDP TRENDS AND FORECAST
TABLE 7 GDP TRENDS AND FORECAST, PERCENTAGE CHANGE (2020–2027)
5.8.3 TRENDS IN GLOBAL CONSTRUCTION INDUSTRY
5.9 SUPPLY CHAIN ANALYSIS
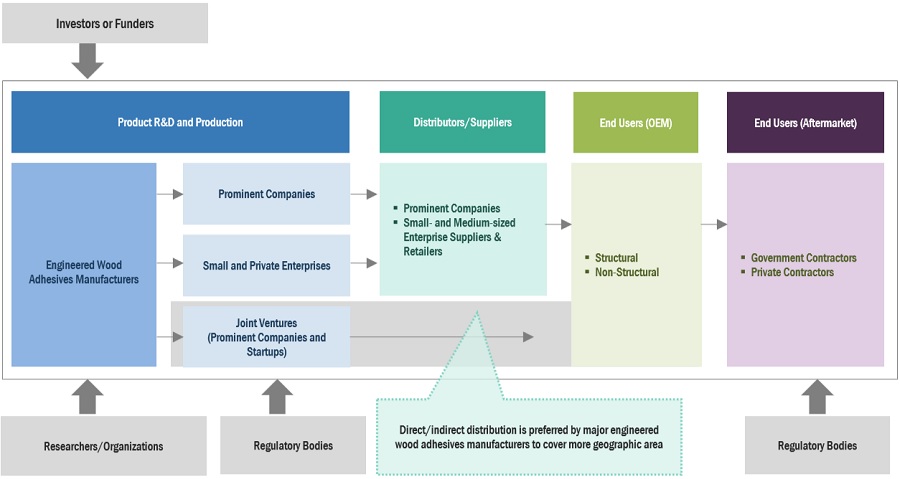
FIGURE 28 ENGINEERED WOOD ADHESIVES MARKET: SUPPLY CHAIN ANALYSIS
5.10 PRICING ANALYSIS
5.10.1 AVERAGE SELLING PRICE TREND, BY REGION
FIGURE 29 AVERAGE SELLING PRICE TREND OF ENGINEERED WOOD ADHESIVES, BY REGION, 2021–2024
TABLE 8 AVERAGE SELLING PRICE OF ENGINEERED WOOD ADHESIVES, BY REGION, 2022–2023 (USD/KG)
5.10.2 AVERAGE SELLING PRICE TREND, BY RESIN TYPE
FIGURE 30 AVERAGE SELLING PRICE TREND OF ENGINEERED WOOD ADHESIVES, BY RESIN TYPE (2023)
5.10.3 AVERAGE SELLING PRICE TREND, BY STRUCTURAL PRODUCT
FIGURE 31 AVERAGE SELLING PRICE TREND OF ENGINEERED WOOD ADHESIVES, BY STRUCTURAL PRODUCT (2023)
5.10.4 AVERAGE SELLING PRICE TREND, BY NON-STRUCTURAL PRODUCT
FIGURE 32 AVERAGE SELLING PRICE TREND OF ENGINEERED WOOD ADHESIVES, BY NON-STRUCTURAL PRODUCT (2023)
5.10.5 AVERAGE SELLING PRICE TREND, BY APPLICATION
FIGURE 33 AVERAGE SELLING PRICE TREND OF ENGINEERED WOOD ADHESIVES, BY APPLICATION (2023)
5.10.6 AVERAGE SELLING PRICE TREND OF KEY PLAYERS, BY APPLICATION
FIGURE 34 AVERAGE SELLING PRICE TREND OF KEY PLAYERS, BY APPLICATION
TABLE 9 AVERAGE SELLING PRICE TREND OF KEY PLAYERS, BY TOP APPLICATIONS, 2023 (USD/KG)
5.11 TRADE ANALYSIS
5.11.1 EXPORT SCENARIO
FIGURE 35 REGION-WISE EXPORT DATA, 2019–2023 (USD THOUSAND)
TABLE 10 COUNTRY-WISE EXPORT DATA, 2021–2023 (USD THOUSAND)
5.11.2 IMPORT SCENARIO
FIGURE 36 REGION-WISE IMPORT DATA, 2019–2023 (USD THOUSAND)
TABLE 11 COUNTRY-WISE IMPORT DATA, 2021–2023 (USD THOUSAND)
5.12 REGULATORY LANDSCAPE AND STANDARDS
5.12.1 REGULATIONS IMPACTING ENGINEERED WOOD ADHESIVES BUSINESS
TABLE 12 EMISSION LIMITS FOR ENGINEERED WOOD PRODUCTS
5.12.1.1 Frequent questions asked
5.12.2 WOOD MANUFACTURING REGULATIONS
5.12.3 ENVIRONMENTAL REGULATIONS FOR WOOD MANUFACTURING
5.12.3.1 Clean Air Act
5.12.3.2 Clean Water Act
5.12.3.3 Toxic Substances Control Act (TSCA)
5.12.4 REGULATORY BODIES, GOVERNMENT AGENCIES, AND OTHER ORGANIZATIONS
TABLE 13 NORTH AMERICA: REGULATORY BODIES, GOVERNMENT AGENCIES, AND OTHER ORGANIZATIONS
TABLE 14 EUROPE: REGULATORY BODIES, GOVERNMENT AGENCIES, AND OTHER ORGANIZATIONS
TABLE 15 ASIA PACIFIC: REGULATORY BODIES, GOVERNMENT AGENCIES, AND OTHER ORGANIZATIONS
5.13 ECOSYSTEM/MARKET MAP
TABLE 16 ENGINEERED WOOD ADHESIVES MARKET: ROLE IN ECOSYSTEM
FIGURE 37 ENGINEERED WOOD ADHESIVES MARKET: ECOSYSTEM MAPPING
FIGURE 38 ENGINEERED WOOD ADHESIVES: ECOSYSTEM ANALYSIS
5.14 TRENDS AND DISRUPTIONS IMPACTING CUSTOMER BUSINESS
FIGURE 39 TRENDS IN END-USE INDUSTRIES IMPACTING BUSINESS OF ENGINEERED WOOD ADHESIVE MANUFACTURERS
5.15 INVESTMENT AND FUNDING SCENARIO
TABLE 17 INVESTMENT AND FUNDING SCENARIO
5.16 PATENT ANALYSIS
5.16.1 METHODOLOGY
5.16.2 PUBLICATION TRENDS
FIGURE 40 PUBLISHED PATENTS, 2019–2023
5.16.3 JURISDICTION ANALYSIS
FIGURE 41 PATENTS PUBLISHED BY JURISDICTION, 2019–2023
5.16.4 TOP APPLICANTS
FIGURE 42 PATENTS PUBLISHED BY MAJOR APPLICANTS, 2019–2023
TABLE 18 TOP PATENT OWNERS
FIGURE 43 TOP PATENT APPLICANTS
5.17 TECHNOLOGY ANALYSIS
5.17.1 KEY TECHNOLOGIES
5.17.1.1 Melamine formaldehyde
5.17.1.2 Phenol resorcinol formaldehyde
5.17.2 COMPLIMENTARY TECHNOLOGIES
5.17.2.1 Polyurethane
5.17.3 ADJACENT TECHNOLOGIES
5.17.3.1 Dowel-laminated timber
5.17.3.2 Mechanical fasteners
5.18 GLOBAL ECONOMIC SCENARIO AFFECTING MARKET GROWTH
5.18.1 RUSSIA–UKRAINE WAR
5.18.2 CHINA
5.18.2.1 Decreasing FDI cooling China’s growth trajectory
5.18.2.2 Environmental commitments
5.18.3 EUROPE
5.18.3.1 Energy crisis in Europe
5.18.4 CHOKEPOINTS THREATENING GLOBAL TRADE
5.18.5 OUTLOOK FOR CHEMICAL INDUSTRY
5.19 CASE STUDY ANALYSIS
5.19.1 CASE STUDY 1
5.19.2 CASE STUDY 2
5.19.3 CASE STUDY 3
5.20 KEY CONFERENCES AND EVENTS
TABLE 19 ENGINEERED WOOD ADHESIVES MARKET: KEY CONFERENCES AND EVENTS, 2024–2025
6 ENGINEERED WOOD ADHESIVES MARKET, BY RESIN TYPE (Page No. - 112)
6.1 INTRODUCTION
FIGURE 44 MELAMINE FORMALDEHYDE TO ACCOUNT FOR LARGEST SHARE OF ENGINEERED WOOD ADHESIVES MARKET
TABLE 20 ENGINEERED WOOD ADHESIVES MARKET, BY RESIN TYPE, 2021–2029 (USD MILLION)
TABLE 21 ENGINEERED WOOD ADHESIVES MARKET, BY RESIN TYPE, 2021–2029 (KILOTON)
6.2 MELAMINE FORMALDEHYDE
6.2.1 UREA
6.2.1.1 Superior bond and cost-effectiveness boosting demand
6.2.2 MELAMINE UREA FORMALDEHYDE
6.2.2.1 High performance and cost-efficiency to boost demand
TABLE 22 MELAMINE FORMALDEHYDE: ENGINEERED WOOD ADHESIVES MARKET, BY REGION, 2021–2029 (USD MILLION)
TABLE 23 MELAMINE FORMALDEHYDE: ENGINEERED WOOD ADHESIVES MARKET, BY REGION, 2021–2029 (KILOTON)
6.3 PHENOL RESORCINOL FORMALDEHYDE
6.3.1 ENHANCED DURABILITY AND STABILITY TO DRIVE DEMAND
TABLE 24 PHENOL RESORCINOL FORMALDEHYDE: ENGINEERED WOOD ADHESIVES MARKET, BY REGION, 2021–2029 (USD MILLION)
TABLE 25 PHENOL RESORCINOL FORMALDEHYDE: ENGINEERED WOOD ADHESIVES MARKET, BY REGION, 2021–2029 (KILOTON)
6.4 POLYURETHANE
6.4.1 ROBUST FLEXIBILITY AND EXCELLENT MOISTURE RESISTANCE TO FUEL DEMAND
TABLE 26 POLYURETHANE: ENGINEERED WOOD ADHESIVES MARKET, BY REGION, 2021–2029 (USD MILLION)
TABLE 27 POLYURETHANE: ENGINEERED WOOD ADHESIVES MARKET, BY REGION, 2021–2029 (KILOTON)
6.5 OTHER RESIN TYPES
TABLE 28 OTHER RESIN TYPES: ENGINEERED WOOD ADHESIVES MARKET, BY REGION, 2021–2029 (USD MILLION)
TABLE 29 OTHER RESIN TYPES: ENGINEERED WOOD ADHESIVES MARKET, BY REGION, 2021–2029 (KILOTON)
7 ENGINEERED WOOD ADHESIVES MARKET, BY PRODUCT (Page No. - 122)
7.1 INTRODUCTION
FIGURE 45 PLYWOOD TO REGISTER HIGHEST CAGR DURING FORECAST PERIOD
FIGURE 46 MEDIUM DENSITY FIBERBOARD TO LEAD MARKET IN NON-STRUCTURAL PRODUCT SEGMENT
TABLE 30 ENGINEERED WOOD ADHESIVES MARKET, BY PRODUCT (STRUCTURAL), 2021–2029 (USD MILLION)
TABLE 31 ENGINEERED WOOD ADHESIVES MARKET, BY PRODUCT (STRUCTURAL), 2021–2029 (KILOTON)
TABLE 32 ENGINEERED WOOD ADHESIVES MARKET, BY PRODUCT (NON-STRUCTURAL), 2021–2029 (USD MILLION)
TABLE 33 ENGINEERED WOOD ADHESIVES MARKET, BY PRODUCT (NON-STRUCTURAL), 2021–2029 (KILOTON)
7.1.1 STRUCTURAL
7.1.1.1 Plywood
7.1.1.1.1 Prominent usage in multiple construction activities to fuel demand
7.1.1.2 Oriented strand board
7.1.1.2.1 Versatile properties suitable for structural applications to drive market
7.1.1.3 Other structural products
7.1.1.3.1 Cross-laminated timber
7.1.1.3.2 Glulam
7.1.1.3.3 Laminated veneer lumber
TABLE 34 PLYWOOD: ENGINEERED WOOD ADHESIVES MARKET, BY REGION, 2021–2029 (USD MILLION)
TABLE 35 PLYWOOD: ENGINEERED WOOD ADHESIVES MARKET, BY REGION, 2021–2029 (KILOTON)
TABLE 36 ORIENTED STRAND BOARD: ENGINEERED WOOD ADHESIVES MARKET, BY REGION, 2021–2029 (USD MILLION)
TABLE 37 ORIENTED STRAND BOARD: ENGINEERED WOOD ADHESIVES MARKET, BY REGION, 2021–2029 (KILOTON)
TABLE 38 OTHER STRUCTURAL PRODUCTS: ENGINEERED WOOD ADHESIVES MARKET, BY REGION, 2021–2029 (USD MILLION)
TABLE 39 OTHER STRUCTURAL PRODUCTS: ENGINEERED WOOD ADHESIVES MARKET, BY REGION, 2021–2029 (KILOTON)
7.1.2 NON-STRUCTURAL
7.1.2.1 Medium density fiberboard
7.1.2.1.1 Structural stability and strength to drive demand
7.1.2.2 Particle board
7.1.2.2.1 Furniture and construction industries to drive market
7.1.3 OTHERS
TABLE 40 MEDIUM DENSITY FIBERBOARD: ENGINEERED WOOD ADHESIVES MARKET, BY REGION, 2021–2029 (USD MILLION)
TABLE 41 MEDIUM DENSITY FIBERBOARD: ENGINEERED WOOD ADHESIVES MARKET, BY REGION, 2021–2029 (KILOTON)
TABLE 42 PARTICLE BOARD: ENGINEERED WOOD ADHESIVES MARKET, BY REGION, 2021–2029 (USD MILLION)
TABLE 43 PARTICLE BOARD: ENGINEERED WOOD ADHESIVES MARKET, BY REGION, 2021–2029 (KILOTON)
TABLE 44 OTHER NON-STRUCTURAL PRODUCTS: ENGINEERED WOOD ADHESIVES MARKET, BY REGION, 2021–2029 (USD MILLION)
TABLE 45 OTHER NON-STRUCTURAL PRODUCTS: ENGINEERED WOOD ADHESIVES MARKET, BY REGION, 2021–2029 (KILOTON)
8 ENGINEERED WOOD ADHESIVES MARKET, BY TECHNOLOGY (Page No. - 136)
8.1 INTRODUCTION
8.2 SOLVENT-BASED
8.2.1 ROBUST PERFORMANCE AND HIGH STRENGTH TO DRIVE DEMAND
8.3 WATER-BASED
8.3.1 EMERGING ECONOMIES TO FUEL DEMAND FOR WATER-BASED ADHESIVES
8.4 SOLVENT-LESS
8.4.1 GROWING DEMAND FROM CONSTRUCTION SECTOR TO DRIVE MARKET
8.5 REACTIVE TECHNOLOGY
8.5.1 EPOXY
8.5.1.1 Resistant to moisture and UV light to fuel demand
8.5.2 POLYURETHANE
8.5.2.1 High durability and structural integrity to support market growth
8.5.3 CYANOACRYLATE
8.5.3.1 Minimal clamp time and durable adhesive to drive demand
8.5.4 POLYISOCYANATE
8.5.4.1 Structural integrity and longevity to drive market
9 ENGINEERED WOOD ADHESIVES MARKET, BY APPLICATION (Page No. - 144)
9.1 INTRODUCTION
FIGURE 47 NON-STRUCTURAL SEGMENT TO DOMINATE OVERALL ENGINEERED WOOD ADHESIVES MARKET
TABLE 46 ENGINEERED WOOD ADHESIVES MARKET, BY APPLICATION, 2021–2029 (USD MILLION)
TABLE 47 ENGINEERED WOOD ADHESIVES MARKET, BY APPLICATION, 2021–2029 (KILOTON)
9.2 STRUCTURAL
9.2.1 STRUCTURAL APPLICATION TO REGISTER HIGH GROWTH RATE DURING FORECAST PERIOD
TABLE 48 STRUCTURAL: ENGINEERED WOOD ADHESIVES MARKET, BY REGION, 2021–2029 (USD MILLION)
TABLE 49 STRUCTURAL: ENGINEERED WOOD ADHESIVES MARKET, BY REGION, 2021–2029 (KILOTON)
9.3 NON-STRUCTURAL
9.3.1 AESTHETIC ADAPTABILITY AND COST-EFFECTIVENESS DRIVING DEMAND IN NON-STRUCTURAL APPLICATIONS
TABLE 50 NON-NSTRUCTURAL: ENGINEERED WOOD ADHESIVES MARKET, BY REGION, 2021–2029 (USD MILLION)
TABLE 51 NON-STRUCTURAL: ENGINEERED WOOD ADHESIVES MARKET, BY REGION, 2021–2029 (KILOTON)
10 ENGINEERED WOOD ADHESIVES MARKET, BY REGION (Page No. - 150)
10.1 INTRODUCTION
TABLE 52 GLOBAL CONSTRUCTION OUTLOOK
FIGURE 48 SHARE OF BUILDINGS IN TOTAL FINAL ENERGY CONSUMPTION IN 2022
FIGURE 49 SHARE OF BUILDINGS IN TOTAL FINAL ENERGY CONSUMPTION IN 2022
FIGURE 50 ASIA PACIFIC TO REGISTER HIGHEST CAGR FOR ENGINEERED WOOD ADHESIVES BETWEEN 2024 AND 2029
TABLE 53 ENGINEERED WOOD ADHESIVES MARKET, BY REGION, 2021–2029 (USD MILLION)
TABLE 54 ENGINEERED WOOD ADHESIVES MARKET, BY REGION, 2021–2029 (KILOTON)
10.2 NORTH AMERICA
TABLE 55 NORTH AMERICA: SUMMARY TABLE OF MARKET FORECASTS FOR 2023 AND 2024
10.2.1 RECESSION IMPACT
FIGURE 51 NORTH AMERICA: ENGINEERED WOOD ADHESIVES MARKET SNAPSHOT
TABLE 56 NORTH AMERICA: ENGINEERED WOOD ADHESIVES MARKET, BY COUNTRY, 2021–2029 (USD MILLION)
TABLE 57 NORTH AMERICA: ENGINEERED WOOD ADHESIVES MARKET, BY COUNTRY, 2021–2029 (KILOTON)
TABLE 58 NORTH AMERICA: ENGINEERED WOOD ADHESIVES MARKET, BY RESIN TYPE, 2021–2029 (USD MILLION)
TABLE 59 NORTH AMERICA: ENGINEERED WOOD ADHESIVES MARKET, BY RESIN TYPE, 2021–2029 (KILOTON)
TABLE 60 NORTH AMERICA: ENGINEERED WOOD ADHESIVES MARKET, BY PRODUCT (STRUCTURAL), 2021–2029 (USD MILLION)
TABLE 61 NORTH AMERICA: ENGINEERED WOOD ADHESIVES MARKET, BY PRODUCT (STRUCTURAL), 2021–2029 (KILOTON)
TABLE 62 NORTH AMERICA: ENGINEERED WOOD ADHESIVES MARKET, BY PRODUCT (NON-STRUCTURAL), 2021–2029 (USD MILLION)
TABLE 63 NORTH AMERICA: ENGINEERED WOOD ADHESIVES MARKET, BY PRODUCT (NON-STRUCTURAL), 2021–2029 (KILOTON)
TABLE 64 NORTH AMERICA: ENGINEERED WOOD ADHESIVES MARKET, BY APPLICATION, 2021–2029 (USD MILLION)
TABLE 65 NORTH AMERICA: ENGINEERED WOOD ADHESIVES MARKET, BY APPLICATION, 2021–2029 (KILOTON)
10.2.2 US
10.2.2.1 Presence of major manufacturers to drive market
TABLE 66 US: ENGINEERED WOOD ADHESIVES MARKET, BY APPLICATION, 2021–2029 (USD MILLION)
TABLE 67 US: ENGINEERED WOOD ADHESIVES MARKET, BY APPLICATION, 2021–2029 (KILOTON)
10.2.3 CANADA
10.2.3.1 Residential construction to drive market
TABLE 68 CANADA: ENGINEERED WOOD ADHESIVES MARKET, BY APPLICATION, 2021–2029 (USD MILLION)
TABLE 69 CANADA: ENGINEERED WOOD ADHESIVES MARKET, BY APPLICATION, 2021–2029 (KILOTON)
10.2.4 MEXICO
10.2.4.1 Investments in infrastructure, energy, and commercial construction projects to drive market
TABLE 70 MEXICO: ENGINEERED WOOD ADHESIVES MARKET, BY APPLICATION, 2021–2029 (USD MILLION)
TABLE 71 MEXICO: ENGINEERED WOOD ADHESIVES MARKET, BY APPLICATION, 2021–2029 (KILOTON)
10.3 EUROPE
10.3.1 RECESSION IMPACT
FIGURE 52 EUROPE: ENGINEERED WOOD ADHESIVES MARKET SNAPSHOT
TABLE 72 EUROPE: ENGINEERED WOOD ADHESIVES MARKET, BY COUNTRY, 2021–2029 (USD MILLION)
TABLE 73 EUROPE: ENGINEERED WOOD ADHESIVES MARKET, BY COUNTRY 2021–2029 (KILOTON)
TABLE 74 EUROPE: ENGINEERED WOOD ADHESIVES MARKET, BY RESIN TYPE, 2021–2029 (USD MILLION)
TABLE 75 EUROPE: ENGINEERED WOOD ADHESIVES MARKET, BY RESIN TYPE, 2021–2029 (KILOTON)
TABLE 76 EUROPE: ENGINEERED WOOD ADHESIVES MARKET, BY PRODUCT (STRUCTURAL), 2021–2029 (USD MILLION)
TABLE 77 EUROPE: ENGINEERED WOOD ADHESIVES MARKET, BY PRODUCT (STRUCTURAL), 2021–2029 (KILOTON)
TABLE 78 EUROPE: ENGINEERED WOOD ADHESIVES MARKET, BY PRODUCT (NON-STRUCTURAL), 2021–2029 (USD MILLION)
TABLE 79 EUROPE: ENGINEERED WOOD ADHESIVES MARKET, BY PRODUCT (NON-STRUCTURAL), 2021–2029 (KILOTON)
TABLE 80 EUROPE: ENGINEERED WOOD ADHESIVES MARKET, BY APPLICATION, 2021–2029 (USD MILLION)
TABLE 81 EUROPE: ENGINEERED WOOD ADHESIVES MARKET, BY APPLICATION, 2021–2029 (KILOTON)
10.3.2 GERMANY
10.3.2.1 Infrastructure enhancement and high for commercial projects upthrust the demand
TABLE 82 GERMANY: ENGINEERED WOOD ADHESIVES MARKET, BY APPLICATION, 2021–2029 (USD MILLION)
TABLE 83 GERMANY: ENGINEERED WOOD ADHESIVES MARKET, BY APPLICATION, 2021–2029 (KILOTON)
10.3.3 AUSTRIA
10.3.3.1 Resurgence of wooden commercial projects to drive demand
TABLE 84 AUSTRIA: ENGINEERED WOOD ADHESIVES MARKET, BY APPLICATION, 2021–2029 (USD MILLION)
TABLE 85 AUSTRIA: ENGINEERED WOOD ADHESIVES MARKET, BY APPLICATION, 2021–2029 (KILOTON)
10.3.4 SWITZERLAND
10.3.4.1 High R&D investments and economic growth propelling demand
TABLE 86 CONSTRUCTION AND HOUSING KEY FIGURES
TABLE 87 SWITZERLAND: ENGINEERED WOOD ADHESIVES MARKET, BY APPLICATION, 2021–2029 (USD MILLION)
TABLE 88 SWITZERLAND: ENGINEERED WOOD ADHESIVES MARKET, BY APPLICATION, 2021–2029 (KILOTON)
10.3.5 ITALY
10.3.5.1 High disposable income and rising FII investments
TABLE 89 ITALY: ENGINEERED WOOD ADHESIVES MARKET, BY APPLICATION, 2021–2029 (USD MILLION)
TABLE 90 ITALY: ENGINEERED WOOD ADHESIVES MARKET, BY APPLICATION, 2021–2029 (KILOTON)
10.3.6 UK
10.3.6.1 Growing construction sector to boost demand
TABLE 91 UK: ENGINEERED WOOD ADHESIVES MARKET, BY APPLICATION, 2021–2029 (USD MILLION)
TABLE 92 UK: ENGINEERED WOOD ADHESIVES MARKET, BY APPLICATION, 2021–2029 (KILOTON)
10.3.7 FRANCE
10.3.7.1 Population growth to generate demand for residential construction to increase demand
TABLE 93 FRANCE: ENGINEERED WOOD ADHESIVES MARKET, BY APPLICATION, 2021–2029 (USD MILLION)
TABLE 94 FRANCE: ENGINEERED WOOD ADHESIVES MARKET, BY APPLICATION, 2021–2029 (KILOTON)
10.3.8 TURKEY
10.3.8.1 Recovery of construction industry to increase demand
TABLE 95 TURKEY: ENGINEERED WOOD ADHESIVES MARKET, BY APPLICATION, 2021–2029 (USD MILLION)
TABLE 96 TURKEY: ENGINEERED WOOD ADHESIVES MARKET, BY APPLICATION, 2021–2029 (KILOTON)
10.3.9 DENMARK
10.3.9.1 Strong infrastructure growth to support demand
TABLE 97 DENMARK: ENGINEERED WOOD ADHESIVES MARKET, BY APPLICATION, 2021–2029 (USD MILLION)
TABLE 98 DENMARK: ENGINEERED WOOD ADHESIVES MARKET, BY APPLICATION, 2021–2029 (KILOTON)
10.3.10 NORWAY
10.3.10.1 Green building projects and stricter building codes to increase demand
TABLE 99 NORWAY: ENGINEERED WOOD ADHESIVES MARKET, BY APPLICATION, 2021–2029 (USD MILLION)
TABLE 100 NORWAY: ENGINEERED WOOD ADHESIVES MARKET, BY APPLICATION, 2021–2029 (KILOTON)
10.3.11 SWEDEN
10.3.11.1 Strategic public-private partnership projects across country to drive market
TABLE 101 SWEDEN: ENGINEERED WOOD ADHESIVES MARKET, BY APPLICATION, 2021–2029 (USD MILLION)
TABLE 102 SWEDEN: ENGINEERED WOOD ADHESIVES MARKET, BY APPLICATION, 2021–2029 (KILOTON)
10.3.12 FINLAND
10.3.12.1 Rising residential construction to increase demand
TABLE 103 FINLAND: ENGINEERED WOOD ADHESIVES MARKET, BY APPLICATION, 2021–2029 (USD MILLION)
TABLE 104 FINLAND: ENGINEERED WOOD ADHESIVES MARKET, BY APPLICATION, 2021–2029 (KILOTON)
10.3.13 SLOVAKIA
10.3.13.1 Economic recovery and rising investment to stabilize demand
TABLE 105 SLOVAKIA: ENGINEERED WOOD ADHESIVES MARKET, BY APPLICATION, 2021–2029 (USD MILLION)
TABLE 106 SLOVAKIA: ENGINEERED WOOD ADHESIVES MARKET, BY APPLICATION, 2021–2029 (KILOTON)
10.3.14 CZECH REPUBLIC
10.3.14.1 Moderate growth and residential housing sector recovery hold demand
TABLE 107 CZECH REPUBLIC: ENGINEERED WOOD ADHESIVES MARKET, BY APPLICATION, 2021–2029 (USD MILLION)
TABLE 108 CZECH REPUBLIC: ENGINEERED WOOD ADHESIVES MARKET, BY APPLICATION, 2021–2029 (KILOTON)
10.3.15 REST OF EUROPE
TABLE 109 REST OF EUROPE: ENGINEERED WOOD ADHESIVES MARKET, BY APPLICATION, 2021–2029 (USD MILLION)
TABLE 110 REST OF EUROPE: ENGINEERED WOOD ADHESIVES MARKET, BY APPLICATION, 2021–2029 (KILOTON)
10.4 ASIA PACIFIC
10.4.1 RECESSION IMPACT
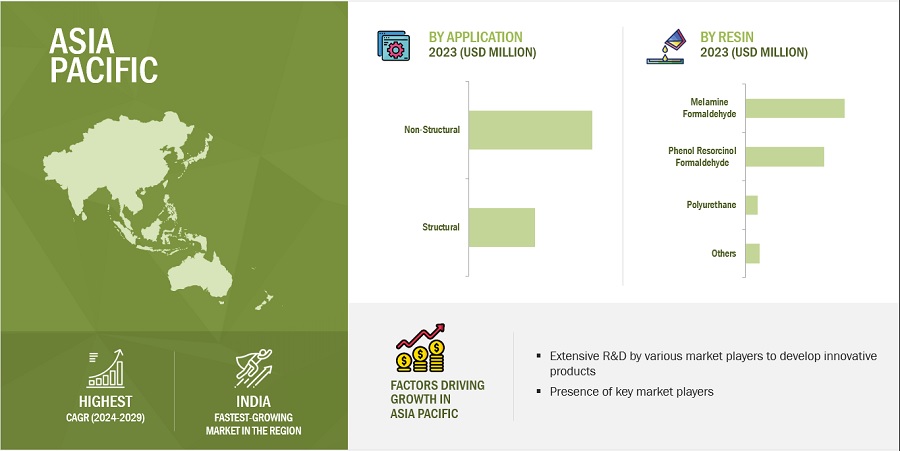
FIGURE 53 ASIA PACIFIC: ENGINEERED WOOD ADHESIVES MARKET SNAPSHOT
TABLE 111 ASIA PACIFIC: ENGINEERED WOOD ADHESIVES MARKET, BY COUNTRY, 2021–2029 (USD MILLION)
TABLE 112 ASIA PACIFIC: ENGINEERED WOOD ADHESIVES MARKET, BY COUNTRY 2021–2029 (KILOTON)
TABLE 113 ASIA PACIFIC: ENGINEERED WOOD ADHESIVES MARKET, BY RESIN TYPE, 2021–2029 (USD MILLION)
TABLE 114 ASIA PACIFIC: ENGINEERED WOOD ADHESIVES MARKET, BY RESIN TYPE, 2021–2029 (KILOTON)
TABLE 115 ASIA PACIFIC: ENGINEERED WOOD ADHESIVES MARKET, BY PRODUCT (STRUCTURAL), 2021–2029 (USD MILLION)
TABLE 116 ASIA PACIFIC: ENGINEERED WOOD ADHESIVES MARKET, BY PRODUCT (STRUCTURAL), 2021–2029 (KILOTON)
TABLE 117 ASIA PACIFIC: ENGINEERED WOOD ADHESIVES MARKET, BY PRODUCT (NON-STRUCTURAL), 2021–2029 (USD MILLION)
TABLE 118 ASIA PACIFIC: ENGINEERED WOOD ADHESIVES MARKET, BY PRODUCT (NON-STRUCTURAL), 2021–2029 (KILOTON)
TABLE 119 ASIA PACIFIC: ENGINEERED WOOD ADHESIVES MARKET, BY APPLICATION, 2021–2029 (USD MILLION)
TABLE 120 ASIA PACIFIC: ENGINEERED WOOD ADHESIVES MARKET, BY APPLICATION, 2021–2029 (KILOTON)
10.4.2 CHINA
10.4.2.1 Significant increase in investments in real estate and non-residential construction to boost market
TABLE 121 CHINA: TIMBER PRODUCTION BY PROVINCE, 2020–2021
TABLE 122 CHINA: ENGINEERED WOOD ADHESIVES MARKET, BY APPLICATION, 2021–2029 (USD MILLION)
TABLE 123 CHINA: ENGINEERED WOOD ADHESIVES MARKET, BY APPLICATION, 2021–2029 (KILOTON)
10.4.3 INDIA
10.4.3.1 Emerging economy and rising FDI investment to drive market
TABLE 124 INDIA: ENGINEERED WOOD ADHESIVES MARKET, BY APPLICATION, 2021–2029 (USD MILLION)
TABLE 125 INDIA: ENGINEERED WOOD ADHESIVES MARKET, BY APPLICATION, 2021–2029 (KILOTON)
10.4.4 JAPAN
10.4.4.1 Investments by government in commercial and reconstruction to boost demand
FIGURE 54 WOOD SUPPLY IN JAPAN (BY COUNTRY)
TABLE 126 JAPAN: ENGINEERED WOOD ADHESIVES MARKET, BY APPLICATION, 2021–2029 (USD MILLION)
TABLE 127 JAPAN: ENGINEERED WOOD ADHESIVES MARKET, BY APPLICATION, 2021–2029 (KILOTON)
10.4.5 SOUTH KOREA
10.4.5.1 Significant expenditure on construction projects to increase demand
TABLE 128 SOUTH KOREA: ENGINEERED WOOD ADHESIVES MARKET, BY APPLICATION, 2021–2029 (USD MILLION)
TABLE 129 SOUTH KOREA: ENGINEERED WOOD ADHESIVES MARKET, BY APPLICATION, 2021–2029 (KILOTON)
10.4.6 INDONESIA
10.4.6.1 Rising consumer spending and growing construction industry to boost market
TABLE 130 INDONESIA: ENGINEERED WOOD ADHESIVES MARKET, BY APPLICATION, 2021–2029 (USD MILLION)
TABLE 131 INDONESIA: ENGINEERED WOOD ADHESIVES MARKET, BY APPLICATION, 2021–2029 (KILOTON)
10.4.7 THAILAND
10.4.7.1 Enhancing tourism, stabilizing private consumption, and boosting public investment to boost market
TABLE 132 THAILAND: ENGINEERED WOOD ADHESIVES MARKET, BY APPLICATION, 2021–2029 (USD MILLION)
TABLE 133 THAILAND: ENGINEERED WOOD ADHESIVES MARKET, BY APPLICATION, 2021–2029 (KILOTON)
10.4.8 MALAYSIA
10.4.8.1 Sustaining domestic demand and rising exports to boost market
TABLE 134 MALAYSIA: ENGINEERED WOOD ADHESIVES MARKET, BY APPLICATION, 2021–2029 (USD MILLION)
TABLE 135 MALAYSIA: ENGINEERED WOOD ADHESIVES MARKET, BY APPLICATION, 2021–2029 (KILOTON)
10.4.9 AUSTRALIA AND NEW ZEALAND
10.4.9.1 Sustainable construction to uphold demand
TABLE 136 AUSTRALIA: ENGINEERED WOOD ADHESIVES MARKET, BY APPLICATION, 2021–2029 (USD MILLION)
TABLE 137 AUSTRALIA: ENGINEERED WOOD ADHESIVES MARKET, BY APPLICATION, 2021–2029 (KILOTON)
10.4.10 REST OF ASIA PACIFIC
TABLE 138 REST OF ASIA PACIFIC: ENGINEERED WOOD ADHESIVES MARKET, BY APPLICATION, 2021–2029 (USD MILLION)
TABLE 139 REST OF ASIA PACIFIC: ENGINEERED WOOD ADHESIVES MARKET, BY APPLICATION, 2021–2029 (KILOTON)
10.5 REST OF THE WORLD
10.5.1 RECESSION IMPACT
FIGURE 55 BRAZIL TO REGISTER HIGHEST CAGR BETWEEN 2024 AND 2029
TABLE 140 REST OF THE WORLD: ENGINEERED WOOD ADHESIVES MARKET, BY COUNTRY, 2021–2029 (USD MILLION)
TABLE 141 REST OF THE WORLD: ENGINEERED WOOD ADHESIVES MARKET, BY COUNTRY, 2021–2029 (KILOTON)
TABLE 142 REST OF THE WORLD: ENGINEERED WOOD ADHESIVES MARKET, BY RESIN TYPE, 2021–2029 (USD MILLION)
TABLE 143 REST OF THE WORLD: ENGINEERED WOOD ADHESIVES MARKET, BY RESIN TYPE, 2021–2029 (KILOTON)
TABLE 144 REST OF THE WORLD: ENGINEERED WOOD ADHESIVES MARKET, BY PRODUCT (STRUCTURAL), 2021–2029 (USD MILLION)
TABLE 145 REST OF THE WORLD: ENGINEERED WOOD ADHESIVES MARKET, BY PRODUCT (STRUCTURAL), 2021–2029 (KILOTON)
TABLE 146 REST OF THE WORLD: ENGINEERED WOOD ADHESIVES MARKET, BY PRODUCT (NON-STRUCTURAL), 2021–2029 (USD MILLION)
TABLE 147 REST OF THE WORLD: ENGINEERED WOOD ADHESIVES MARKET, BY PRODUCT (NON-STRUCTURAL), 2021–2029 (KILOTON)
TABLE 148 REST OF THE WORLD: ENGINEERED WOOD ADHESIVES MARKET, BY APPLICATION, 2021–2029 (USD MILLION)
TABLE 149 REST OF THE WORLD: ENGINEERED WOOD ADHESIVES MARKET, BY APPLICATION, 2021–2029 (KILOTON)
10.5.2 BRAZIL
10.5.2.1 Easy availability of raw materials to propel market growth
TABLE 150 BRAZIL: ENGINEERED WOOD ADHESIVES MARKET, BY APPLICATION, 2021–2029 (USD MILLION)
TABLE 151 BRAZIL: ENGINEERED WOOD ADHESIVES MARKET, BY APPLICATION, 2021–2029 (KILOTON)
10.5.3 ARGENTINA
10.5.3.1 Increase in population and improved economic conditions to drive demand
TABLE 152 ARGENTINA: ENGINEERED WOOD ADHESIVES MARKET, BY APPLICATION, 2021–2029 (USD MILLION)
TABLE 153 ARGENTINA: ENGINEERED WOOD ADHESIVES MARKET, BY APPLICATION, 2021–2029 (KILOTON)
10.5.4 SOUTH AFRICA
10.5.4.1 Growing building projects to increase demand
TABLE 154 SOUTH AFRICA: ENGINEERED WOOD ADHESIVES MARKET, BY APPLICATION, 2021–2029 (USD MILLION)
TABLE 155 SOUTH AFRICA: ENGINEERED WOOD ADHESIVES MARKET, BY APPLICATION, 2021–2029 (KILOTON)
10.5.5 OTHER COUNTRIES
TABLE 156 OTHER COUNTRIES: ENGINEERED WOOD ADHESIVES MARKET, BY APPLICATION, 2021–2029 (USD MILLION)
TABLE 157 OTHER COUNTRIES: ENGINEERED WOOD ADHESIVES MARKET, BY APPLICATION, 2021–2029 (KILOTON)
11 COMPETITIVE LANDSCAPE (Page No. - 226)
11.1 KEY PLAYER STRATEGIES
11.1.1 BY KEY PLAYERS STRATEGIES/RIGHT TO WIN, (JANUARY 2018 TO DECEMBER 2023) 226
TABLE 158 OVERVIEW OF STRATEGIES ADOPTED BY KEY MARKET PLAYERS (JANUARY 2018 TO DECEMBER 2023)
11.2 MARKET SHARE ANALYSIS
FIGURE 56 MARKET SHARE ANALYSIS, 2023
TABLE 159 ENGINEERED WOOD ADHESIVES MARKET: DEGREE OF COMPETITION
11.2.1 MARKET RANKING ANALYSIS
FIGURE 57 MARKET RANKING ANALYSIS, 2023
11.3 TOP 5 PLAYERS’ REVENUE ANALYSIS
FIGURE 58 MARKET REVENUE ANALYSIS OF TOP FIVE PLAYERS
11.4 COMPANY VALUATION AND FINANCIAL METRICS, 2023
11.4.1 COMPANY VALUATION
FIGURE 59 COMPANY VALUATION
11.4.2 FINANCIAL METRICS
FIGURE 60 FINANCIAL METRICS
11.5 BRAND/PRODUCT COMPARATIVE ANALYSIS
11.5.1 BRAND/PRODUCT COMPARATIVE ANALYSIS
FIGURE 61 BRAND/PRODUCT COMPARATIVE ANALYSIS
11.6 COMPANY EVALUATION MATRIX: KEY PLAYERS, 2023
11.6.1 STARS
11.6.2 EMERGING LEADERS
11.6.3 PERVASIVE PLAYERS
11.6.4 PARTICIPANTS
FIGURE 62 ENGINEERED WOOD ADHESIVES MARKET: COMPANY EVALUATION MATRIX, KEY PLAYERS, 2023
FIGURE 63 PRODUCT FOOTPRINT (25 COMPANIES)
11.6.5 COMPANY FOOTPRINT: KEY PLAYERS
TABLE 160 COMPANY FOOTPRINT (25 COMPANIES)
TABLE 161 REGION FOOTPRINT (25 COMPANIES)
TABLE 162 APPLICATION FOOTPRINT (25 COMPANIES)
TABLE 163 RESIN TYPE FOOTPRINT (25 COMPANIES)
TABLE 164 PRODUCT FOOTPRINT (25 COMPANIES)
11.7 COMPANY EVALUATION MATRIX: STARTUPS/SMES, 2023
11.7.1 PROGRESSIVE COMPANIES
11.7.2 RESPONSIVE COMPANIES
11.7.3 DYNAMIC COMPANIES
11.7.4 STARTING BLOCKS
FIGURE 64 ENGINEERED WOOD ADHESIVES MARKET: COMPANY EVALUATION MATRIX, STARTUPS/SMES, 2023
11.7.5 COMPETITIVE BENCHMARKING
11.7.5.1 Detailed list of key startups/SMEs
TABLE 165 ENGINEERED WOOD ADHESIVES MARKET: DETAILED LIST OF KEY STARTUPS/SMES
11.7.5.2 Competitive benchmarking of key startups/SMEs
TABLE 166 ENGINEERED WOOD ADHESIVES MARKET: COMPETITIVE BENCHMARKING
11.8 COMPETITIVE SCENARIO AND TRENDS
11.8.1 ENGINEERED WOOD ADHESIVES MARKET: PRODUCT LAUNCHES, JANUARY 2018–DECEMBER 2023
TABLE 167 ENGINEERED WOOD ADHESIVES MARKET: PRODUCT LAUNCHES, JANUARY 2018–DECEMBER 2023
11.8.2 ENGINEERED WOOD ADHESIVES MARKET: DEALS, JANUARY 2018–DECEMBER 2023
TABLE 168 ENGINEERED WOOD ADHESIVES MARKET: DEALS, JANUARY 2018–DECEMBER 2023
11.8.3 ENGINEERED WOOD ADHESIVES MARKET: EXPANSIONS, JANUARY 2018–DECEMBER 2023
TABLE 169 ENGINEERED WOOD ADHESIVES MARKET: EXPANSIONS, JANUARY 2018–DECEMBER 2023
12 COMPANY PROFILES (Page No. - 251)
(Business overview, Products/Solutions/Services offered, Recent Developments, MnM view, Key strengths, Strategic choices, Weaknesses and competitive threats) *
12.1 MAJOR PLAYERS
12.1.1 H.B. FULLER COMPANY
TABLE 170 H.B. FULLER COMPANY: BUSINESS OVERVIEW
FIGURE 65 H.B. FULLER COMPANY: COMPANY SNAPSHOT
TABLE 171 H.B. FULLER COMPANY: PRODUCTS/SERVICES/SOLUTIONS OFFERED
TABLE 172 H.B. FULLER COMPANY: DEALS, JANUARY 2018–DECEMBER 2023
TABLE 173 H.B. FULLER COMPANY: EXPANSIONS, JANUARY 2018– DECEMBER 2023
12.1.2 HENKEL AG & CO. KGAA
TABLE 174 HENKEL AG & CO. KGAA: COMPANY OVERVIEW
FIGURE 66 HENKEL AG & CO. KGAA: COMPANY SNAPSHOT
TABLE 175 HENKEL AG & CO. KGAA: DEALS, JANUARY 2018–DECEMBER 2023
TABLE 176 HENKEL AG & CO. KGAA: EXPANSIONS, JANUARY 2018–DECEMBER 2023
12.1.3 AKZO NOBEL N.V.
TABLE 177 AKZO NOBEL N.V.: COMPANY OVERVIEW
FIGURE 67 AKZO NOBEL N.V.: COMPANY SNAPSHOT
12.1.4 ARKEMA SA
TABLE 178 ARKEMA SA: COMPANY OVERVIEW
FIGURE 68 ARKEMA SA: COMPANY SNAPSHOT
TABLE 179 ARKEMA SA: DEALS, JANUARY 2018–DECEMBER 2023
12.1.5 BASF SE (JANUARY 2018 – DECEMBER 2023)
TABLE 180 BASF SE: COMPANY OVERVIEW
FIGURE 69 BASF SE: COMPANY SNAPSHOT
TABLE 181 BASF SE: PRODUCTS/SOLUTIONS/SERVICES OFFERINGS
TABLE 182 BASF SE: DEALS, JANUARY 2018–DECEMBER 2023
12.1.6 DOW
TABLE 183 DOW: COMPANY OVERVIEW
FIGURE 70 DOW: COMPANY SNAPSHOT
12.1.7 HUNTSMAN CORPORATION
TABLE 184 HUNTSMAN CORPORATION: COMPANY OVERVIEW
FIGURE 71 HUNTSMAN CORPORATION: COMPANY SNAPSHOT
TABLE 185 HUNTSMAN CORPORATION: DEALS, JANUARY 2018–DECEMBER 2023
12.1.8 AICA KOGYO CO., LTD.
TABLE 186 AICA KOGYO CO., LTD.: COMPANY OVERVIEW
FIGURE 72 AICA KOGYO CO., LTD.: COMPANY SNAPSHOT
TABLE 187 AICA KOGYO CO., LTD.: PRODUCTS/SOLUTIONS/SERVICES OFFERINGS
12.1.9 ASTRAL LIMITED
TABLE 188 ASTRAL LIMITED: COMPANY OVERVIEW
FIGURE 73 ASTRAL LIMITED: COMPANY SNAPSHOT
TABLE 189 ASTRAL LIMITED: PRODUCTS/SOLUTIONS/SERVICES OFFERINGS
12.1.10 HE
13 APPENDIX (Page No. - 303)
13.1 DISCUSSION GUIDE
13.2 KNOWLEDGESTORE: MARKETSANDMARKETS’ SUBSCRIPTION PORTAL
13.3 CUSTOMIZATION OPTIONS
13.4 RELATED REPORTS
13.5 AUTHOR DETAILS


Growth opportunities and latent adjacency in Engineered Wood Adhesives Market